

Deploying a Machine Learning App Using Streamlit: An In-Depth Explanation


Table of contents
Introduction
Machine Learning Algorithms are now used for data analysis and AI-based solutions. Every avid reader of technology news will know how much attention these topics have recently received.
With the advent of Machine Learning (ML), advanced applications have been built to analyse data to detect patterns and predict future events based on historical data. Instead of relying on human or manual analysis, businesses deploy machine learning algorithms for automated insights.
A machine learning algorithm amassed its full potential when deployed into production. Insights are obtained and tests are conducted on data being fed into the algorithm. There are numerous tools for deploying machine learning applications, as per your specific needs and requirements. Some of these tools include Streamlit, Gradio, Flask, and FastAPI.
In this context, a quick and easy solution is brought to your face. It is however recommended that you read this blog thoroughly and understand the step-by-step process of deploying a machine-learning app using Streamlit.
Getting Started with Streamlit
Streamlit is an open-source app framework used by Machine Learning engineers and other data science team members. It is also a beginner-friendly method of deploying machine learning algorithms. With Streamlit, it’s easy to turn machine-learning codes into shareable web apps within minutes while taking away the stress of working on the application’s front end.
The Streamlit team provided a free and easy-to-use deployment mode to reduce your worries about deploying to the cloud. The Streamlit Cloud makes it easy to deploy, manage and share your ML app with everyone.

Streamlit Input Widgets
When deploying a web app using Streamlit, widgets are provided by the Streamlit team to reduce the stress of writing excess code. This section explains some of the streamlit widgets alongside their syntax below:
st.form(): The Streamlit form is used with the form_submit_button to simplify users' input of multiple pieces of information without needing to reload after every input. The Streamlit widget can be declared using the
withstatement.with st.form(key = "form"): name = st.text_input( label="Name") tel = st.number_input(label="Telephone No.") # submit button for the form submit = st.form_submit_button(label="Submit Form") if submit: st.write("Name:", name, "Phone Number:", tel) else: st.write("Kindly fill form") """ label = short explanation of what the inputted value is for NOTE: When using the form, it's important to add the else statement unless Python returns an UnBoundError. """st.text_input(): The text input widget receives text information from the user.
  name= st.text_input(label="Name:")

  st.write("My name is", name)
st.number_input(): The number input widget receives integer values from the end-user.
  tel = st.number_input(label="Telephone Number:")

  st.write("You can reach me on this number", tel)
st.slider(): This widget allows users to select integer values by simply moving the slider to the number of their choice.
  age = st.slider(label="Age",min_value= 0, max_value=100)

  st.write("I'm", age, "year old")
  """
   where min_value = minimum value,
   max_value = maximum value
  """
st.selectbox(): The selectbox widget helps the end-user can select a choice among the available options.
  gender = st.selectbox(label="Gender:", options=\["Male", "Female"\])

  st.write("I'm a", gender, "patient")
To learn more about the Streamlit input widgets, you can make use of the streamlit documentation to get more knowledge of Streamlit.
Building a Diabetes Prediction Application.
Here is a detailed explanation of the installation and deployment process. This section will provide a step-by-step process for building a diabetes prediction app using the diabetes dataset. You'll discover how Streamlit builds and deploys the machine learning model on the local computer and the Streamlit Cloud.
Prerequisites
To get a good understanding of this tutorial, the reader should have the following knowledge:
Proficiency with the use of Python Programming Language.
Data Cleaning and Wrangling.
Basic knowledge of how to build machine learning models.
Understanding of Git and GitHub.
While working on this project, Anaconda or DataSpell by JetBrains can be used to carry out the tutorial. Here's a quick guide on how to install Anaconda.
Project Directories
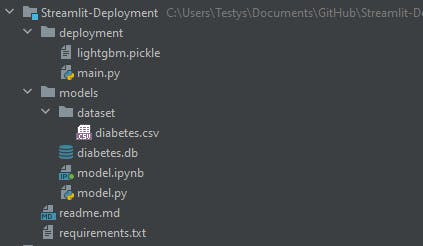
For this tutorial, two folders namely; the deployment and the models’ folders are created. The deployment folder contains the streamlit code and the pickle file to save the trained ML model. The models' folder contains:
The dataset folder which contains the diabetes dataset is saved in the models’ folder.
the python script for the machine learning code, and
a notebook that contains tests and wrangling carried out on the diabetes data.
The project contains other files like the readme file, which explains what the project does, and the requirements.txt file which keeps a record of all the necessary libraries required to run the Streamlit code smoothly.
Installation
Specific Python libraries are required to ensure the effective running of the deployment. First, the Streamlit library is installed using pip, which is installed with Anaconda. The code is written below;
pip install streamlit
To confirm that the Streamlit library was successfully installed, call streamlit hello whose output displays the Streamlit homepage on the browser.
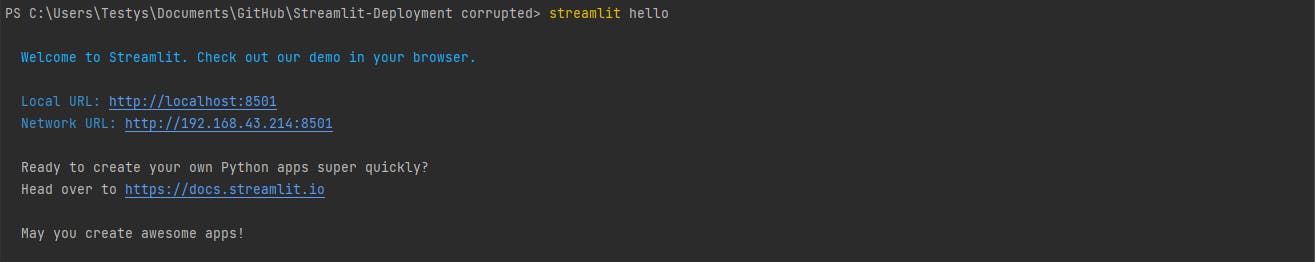
It verifies that the Streamlit library has been installed successfully and would work smoothly unless faced with an error.
When working with the machine learning code, it is important to install the algorithm to be used. In the case of this tutorial, the LGBMClassifier would be used to carry out the diabetes classification task. Install the library Using pip, just like the former.
pip install lightgbm
A Glimpse at ML Script
In this tutorial, we'll quickly examine and explain the machine-learning code. We must organize the diabetic dataset and may choose to add new features as necessary. The required data processing must be done for the data to pass through the ML model without any issues. The complete code for the machine learning model is provided below:
Import the libraries to be used when on the dataset, which includes;
pandas for cleaning and wrangling,
scikit-learn for normalising the data, splitting the data, and training the model.
The pickle library is used to save the model into a pickle file. The project uses the pickle library to import the model to be used when deploying with streamlit.
From this point, the data is loaded using the pandas’ read_csv module, it is then wrangled to replace wrongly written values. The columns with object variables are then taken care of by using the OrdinalEncoding class. By using the RobustScaler class, the integer values are then scaled to remove outliers, thereby increasing the performance of our model.
To be able to train our machine learning model, we would split our data into train data and test data. In this tutorial, we split our data using StratifiedShuffleSplit. The syntax to easily use the StratifiedShuffleSplit is shown below:
# first, define the number of splits you would like to make
splits = StratifiedShuffleSplit(n_splits= n_splits, random_state= random_state)

for train_index, test_index in splits.split(X, y)
X_train, X_test = X[train_index], X[test_index]
y_train, y_test = y[train_index], y[test_index]

"""
where n_splits = number of splits you would like,
random_state = random number that is set to make results reproducible,
X = data after preprocessing and dropping the target,
y = target
"""
Afterwards, an instance of the LGBMClassifier is saved to a name of our choice, in this case, lgbm. The LGBMClassifier hyperparameters are also tuned to improve accuracy. The X_train and y_train after splitting are used to train the model. After the model is trained, the performance metric of the model is checked using the f1_score. The f1_score is obtained after comparing the result obtained from predicting the X_test and the y_test values. Based on the f1_score gotten, an accuracy of approximately 96% was gotten after training our model on the dataset.
The pickle library saves the trained model. The saved model is imported into the streamlit code to predict inputs from the end users. The syntax for saving a model using pickle is written below:
import pickle

# we start by opening a pickle file with any name of our choice.
var_name = open(file_name, "wb")
# we then dump the trained model into the opened pickle file.
pickle.dump(model_name, var_name)
# after dumping the model, it's necessary to close the open pickle file.
var_name.close()

"""
var_name = variable name of your choice.
file_name = name pickle file is saved with e.g "lightgbm.pickle".
model_name = name used for the model variable.
"""
Streamlit App Script.
Completing the machine learning code is the first step towards attaining the goal. The machine learning code provides the model to be used when carrying out the diabetes classification task. Receiving information from the end-users in this case, Health workers is a top priority. Information received is used to carry out prediction using the machine learning model trained with existing data. Streamlit, as mentioned above has made it easy to write a shareable app with Python without having to write HTML or JavaScript.
With the use of streamlit and the knowledge of functions, a simple interface where the end-users can easily supply patients’ information and receive the result within 5 minutes is created. Create a python file and start by importing the necessary libraries.
# importing important libraries
import streamlit as st
import joblib
import numpy as np
import time
The streamlit library, and forms that the app would entail are imported first. Then joblib, which does the job of dumping the pickle file created in the ML Script section, is imported next. The use of numpy makes it easy to create a data frame which contains information on patients supplied by the end-users.
joblib houses the pickle file which was created under the ML script section and is dumped into a variable name to be used when predicting results for new data. The pickle file is dumped using the syntax below:
var_name = open(file_name, "wb")
model = joblib.dump(var_name)

"""
file_name = name of pickle file as saved above.
model = trained model from machine learning code.
"""
Creating different python functions easily helps to receive information from end-users, and also predict the results. While working on this tutorial, it’s crucial to get some information from the end users. These pieces of information are features which would be used when predicting the result. Some of the data needed to predict the diabetes status of patients are stored in the variable name, column_name, below:
# column name for each feature in the diabetes dataset.
column_names = ['cholesterol', 'glucose', 'hdl_chol', 'chol_hdl_ratio',
'age', 'gender', 'weight', 'height', 'bmi', 'systolic_bp', 'diastolic_bp', 'waist', 'hip', 'waist_hip_ratio']
To get this information from the end-users, using the streamlit input widgets we learned about, we can come up with a means of acquiring data from the end-users. This can be done effectively by creating a function to receive this data.
# function to receive users' information.
def inputs():
    # creating the form for data inputs.
    with st.form(key="diabetes_data"):
        name = st.text_input("Patient's Name: ")
        gender_obj = st.selectbox(label="Patient's Gender: ", options=["Male", "Female"])
        if gender_obj == "Male":
            gender = 1
        else:
            gender = 0

        age = st.slider(label="Patient's Age: ", min_value=0, max_value=100)
        chol = st.slider(label="Patient's Cholesterol Level(mg/dL): ", min_value=40, max_value=400)
        glucose = st.slider(label="Patient's Sugar Level(mg/dL): ", min_value=40, max_value=250)
        height_cm = st.number_input(label="Patient's Height(cm): ")
        height = height_cm * 0.393701
        weight_kg = st.number_input("Patient's Weight in(kg): ")
        weight = weight_kg * 2.205
        hdl_chol = st.slider(label="Patient's HDL Cholesterol(mg/dL): ", min_value=0, max_value=100)
        waist = st.number_input("Patient's Waist Size(inches): ", step=1)
        hip = st.number_input("Patient's Hip Size(inches): ", step=1)
        systolic_bp = st.number_input(label="Patient's Systolic Blood Pressure(mmHg): ", step=1)
        diastolic_bp = st.number_input(label="Patient's Diastolic Blood Pressure(mmHg): ", step=1)
        submit = st.form_submit_button("Submit Test")
        if submit:
            bmi = weight_kg / ((height_cm / 100)**2)
            chol_hdl_ratio = chol / hdl_chol
            waist_hip_ratio = waist/hip
            patient_data = [chol, glucose, hdl_chol, chol_hdl_ratio, age, gender, weight, height, bmi, systolic_bp, diastolic_bp, waist, hip, waist_hip_ratio]
        else:
            patient_data = [0, 0, 0, 0, 0, 0, 0, 0, 0, 0, 0, 0, 0, 0]
    return patient_data
After carrying out the calculation necessary for some features, this function collates all the collected data into a list that is then used when predicting the result. A function that saves this data in a data frame carries out predictions on the data supplied by the user. The numpy module, easily creates a new data frame each time the user inputs new data.
# function to create a data frame and carry out prediction.
def predict(var_name):
    pred = [var_name]
    np_pred = np.array(pred)
    score = lgbm_model.predict(np_pred)
    return score
Both functions written above are used in a new function, which is the streamlit function. The streamlit function we would be writing would be used to run the streamlit app upon completion.
# function to run streamlit app
def run():
    st.title("Diabetes Test App")
    st.write("Diabetes is known as a very deadly disease if not diagnosed early. To make it easier for health practitioners to diagnose this disease early, previous data have been accumulated to predict an accurate result for new patients. The Doctor is to retrieve the necessary information from the patients to carry out this test. A diabetic patient should be notified early and should commence treatment immediately.")
    info = inputs()
    dia_score = predict(info)
    with st.spinner(text="Diagnosing....."):
        time.sleep(5)
    if dia_score == 1:
        st.error("Positive. Diabetes Diagnosed.")
    else:
        st.success("Negative. Diabetes not diagnosed.")

# running streamlit app.
if __name__ == "__main__":
    run()
This function displays the name of the streamlit app being created along with a brief explanation of its functionality. The inputs function mentioned is used, and the data obtained is passed to the prediction function that makes a prediction about the patient's status. The patient can be informed of the outcome using a function in streamlit that uses the success or error status.
In the next section, we take a deep dive into how to run the complete streamlit app on our local machine.
Running on a Local Machine
It is essential to test our streamlit software before deploying it into the cloud. Bugs are easily found in the app during testing before it is finally released on the cloud. Without the internet, testing an app on our computers is now straightforward thanks to Streamlit.
The anaconda command prompt runs and tests the application and the directory for the project folder is switched after launching the Anaconda command prompt.
# Syntax to change directory.
cd project_directory

"""
where project_directory = directory for the project folder,
in this case, directory = C:\Users\Testys\Documents\GitHub\Streamlit-Deployment
"""
Since our streamlit code is saved under the deployment folder, it is possible to run the code from our command prompt by using streamlit run ./deployment/main.py
The streamlit app is viewed on the internet browser. The output diagram looks more like this.
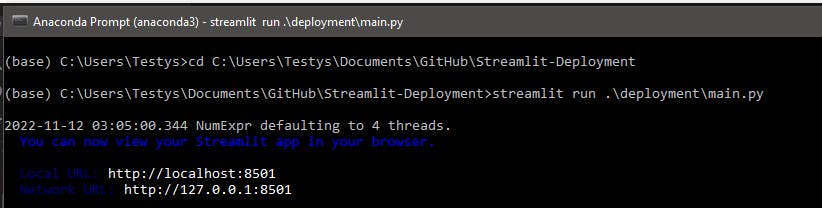
The streamlit app looks like this on the browser:
Deploying on Streamlit Cloud
Another duty is to widely distribute the finished streamlit app and this can be done in a variety of ways. Examples of these techniques include Streamlit Cloud, HuggingFace, and AWS Cloud. Streamlit Cloud will be used in this article. It only takes five minutes to launch the finished app to Streamlit. The following represent the processes to properly perform this task:
Uploading on GitHub.
Streamlit Cloud in operation
Uploading on GitHub
The project directory is created on the cloud using GitHub for simple access from Streamlit Cloud. You must have a GitHub account to do this. You can get more information on this page
The GitHub account is to create a repository where the file will be uploaded. The repo name may be saved with any name at our discretion.
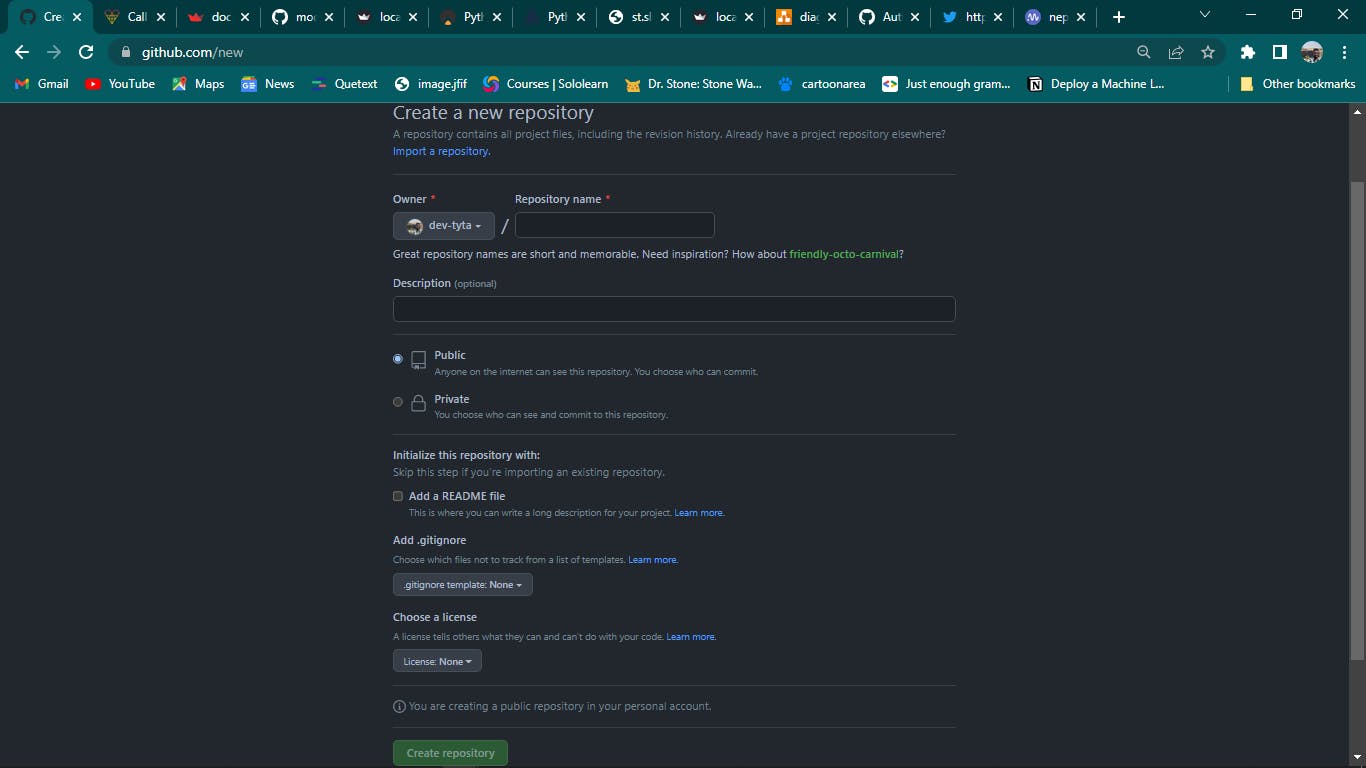
The project files have to be uploaded to GitHub. By doing this, the Streamlit cloud is connected to the streamlit app script.
Streamlit Cloud in Operation
To deploy the streamlit app on Streamlit Cloud, one must sign up for Streamlit Cloud. The signup page can be found on the main page of the streamlit website. The Streamlit sign-up page looks like this:
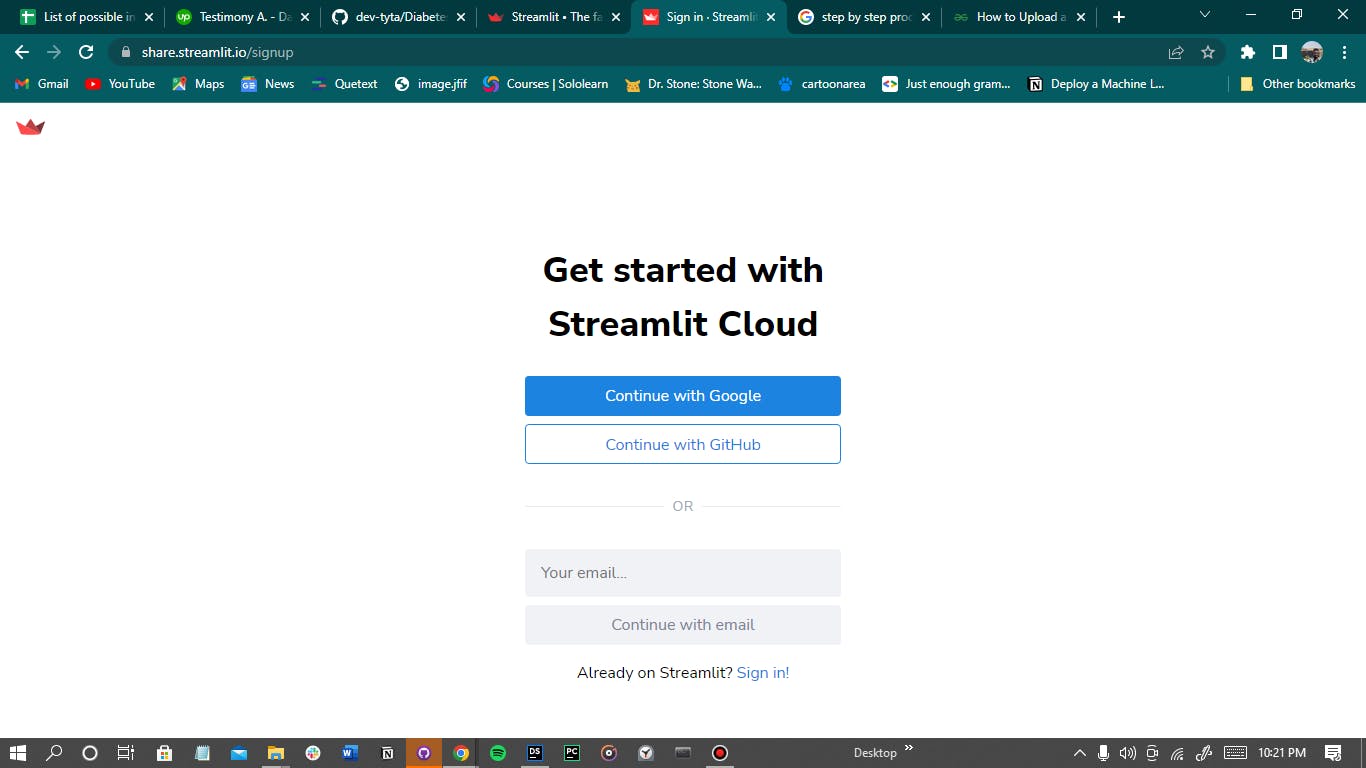
It is advisable to sign up with GitHub to make it easier to connect to the project repo. Once the Streamlit Cloud account is created, the next page to be displayed is a page for the streamlit app that has been successfully deployed by the user;
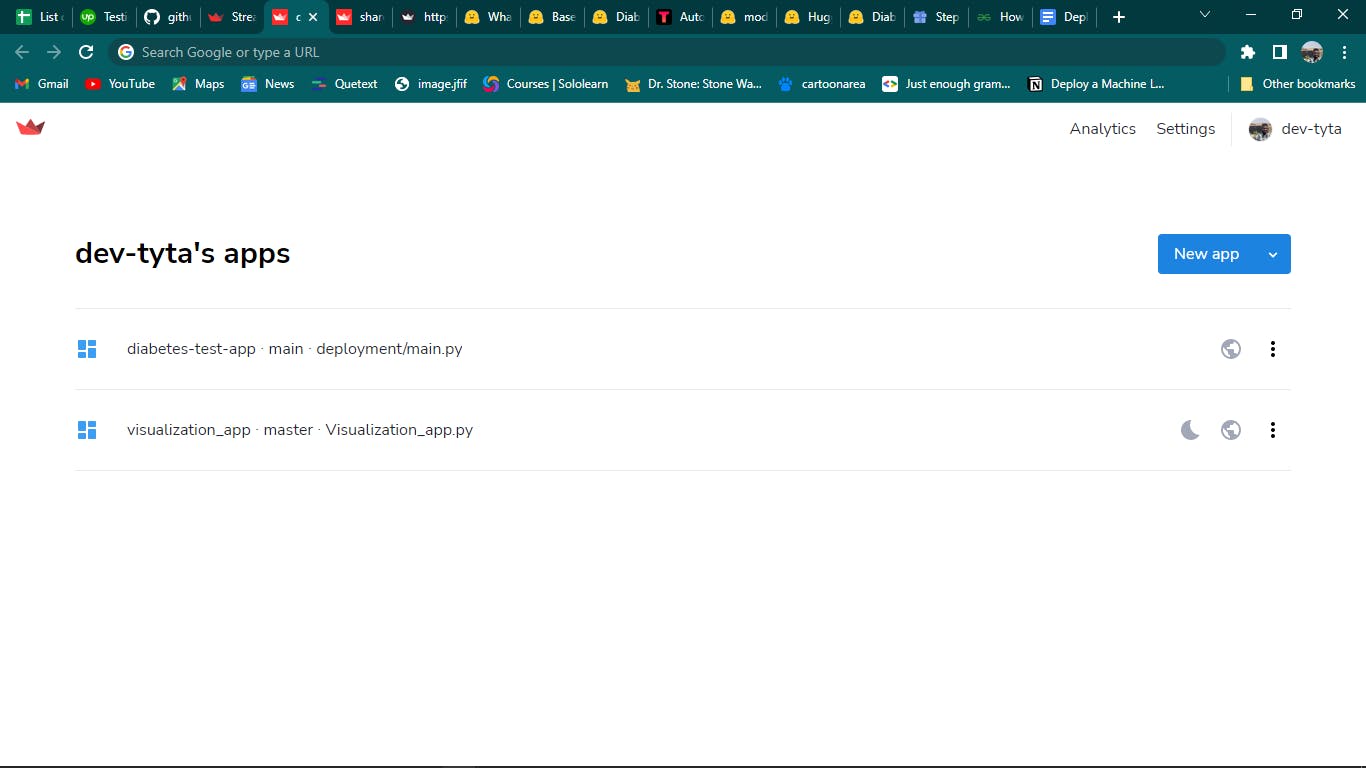
To deploy a new app, we can simply click the New App button, which leads us to a page that connects our streamlit app on GitHub to Streamlit Cloud. On this page, you as a developer can manage the apps you have access to, that is, the ability to delete, and edit the URL link and also get access to the site analytics.
After clicking the new app button, it leads to a page linked to GitHub where the repository for the project at hand is picked. Upon picking the repository, it receives the location of the streamlit app to be deployed.
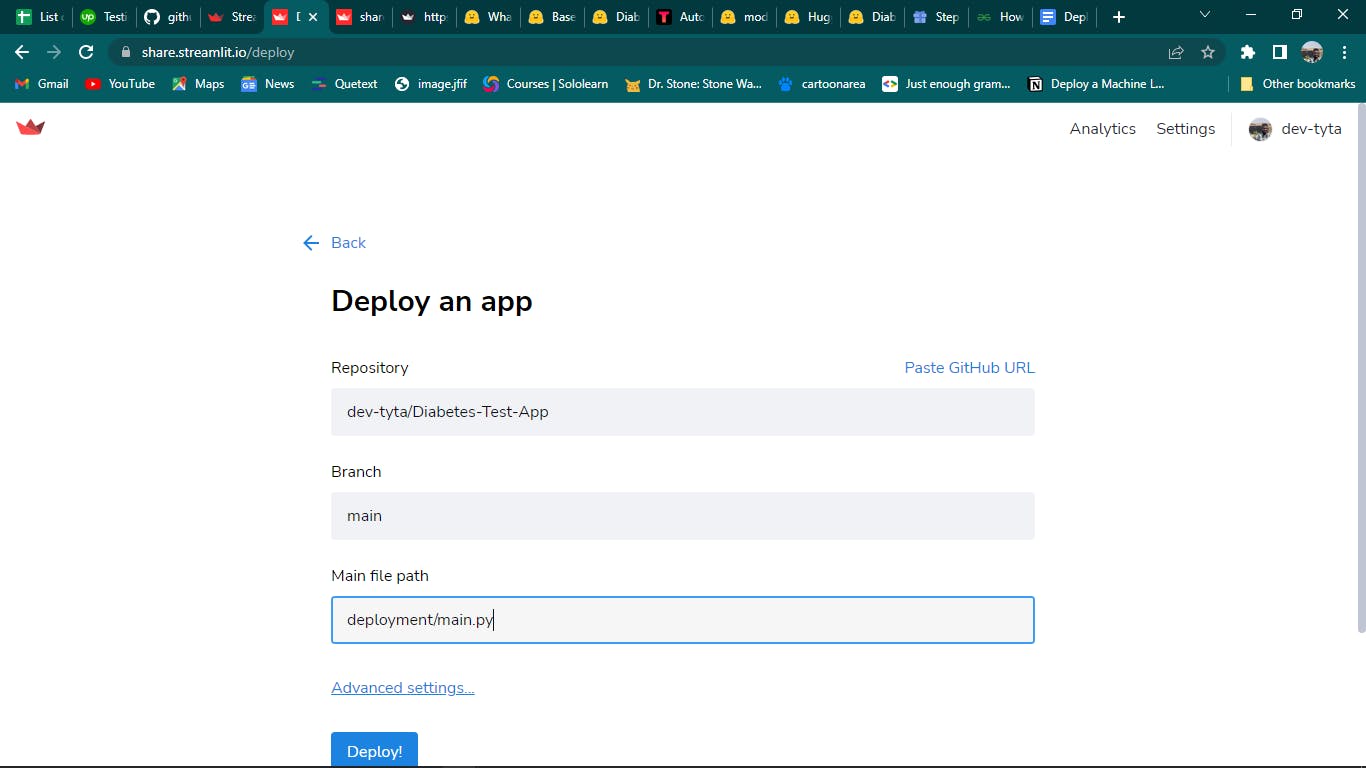
Within three minutes, Streamlit Cloud deploys the streamlit app. An example of how the streamlit app was built during this tutorial is shown below.
In conclusion, the ultimate objective of every model is to collect data from the users and generate forecasts based on past patterns or occurrences. A web interface to receive the required data can be quickly created using Streamlit. You can simply get the finished web page for the preceding tutorial here. Here is also a link to the structured GitHub repository.
To learn more, do well to practice, share, and follow. After finishing the tutorial, you may also provide a link to your Streamlit application. Gracias.